

Sizing Up the Market
How I like to build out TAM models

One of the staples of investment research is market sizing. It’s also a highly debated topic (especially in venture) since you need to size a market that may not even exist yet (think Uber, Airbnb, or even early internet-based companies!).
I’ve built a lot of market sizing models over the years, so I wanted to take some time to share my process and a few places that I like to start.
I’ll use the example of a B2B SaaS startup to keep things simple. Let’s dive in:
Bottom-Up Vs. Top-Down
As an investor, there is really only one way I’ll size a market. The number of customers multiplied by some sort of monetization rate (business model). This gives me a very objective way of looking at the market in terms of the customer, their willingness to pay, and the startup’s ability to command a certain price.
On the other hand, I’m sure we have all seen the headlines for $4k market research reports (here is one below in case you haven’t):

While the contents of the report might be insightful, that top-down market size tells us nothing. What customer segments are included? What industries? Is this the total spend on SaaS? Unless you are willing to pay the high price to unlock those answers, you can’t use that figure in an investment memo.
Finding Data for a Bottom’s Up Analysis
One of the biggest challenges with building a bottom-up model is finding the appropriate data to populate it with. Let’s go back to our B2B SaaS market, below would be my exact process & data sources.
Searching for a data source
Recently, I’ve been utilizing ChatGPT & Google Bard to help find data sources. I wrote about using AI in venture a while back, and while these tools have a lot of shortcomings - they are great for drinking from the fire hose and finding something useful at the same time.
In this case, ChatGPT led me to the United States Census Bureau which had the data we were looking for:

Above is a table that shows the total number of employees in an industry, organized by company size. Perfect for understanding our B2B SaaS market!
For the startup in our example, let’s say they charge on a “per seat” basis. In this case, if we drill down to say, finance & insurance companies (NAICS code 52), we can see that there are ~6.68 million people working in this industry:
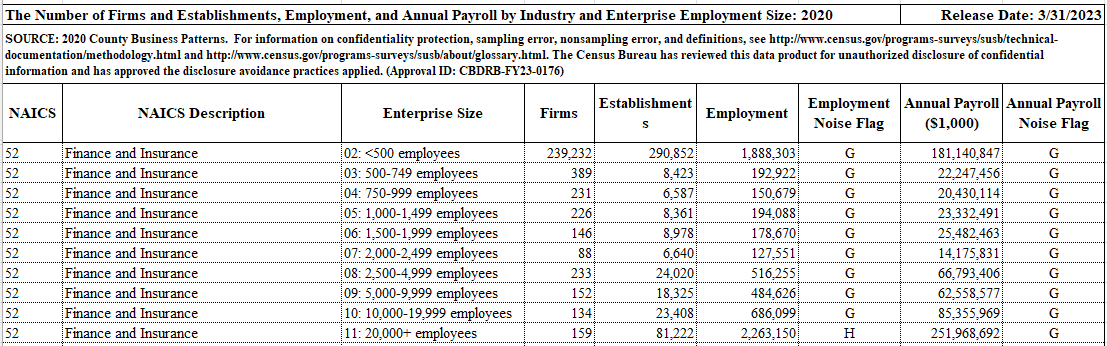
We could even drill further down based on the startup’s ICP. Let’s say that the ideal customers for this company are finance & insurance firms with less than 500 employees. In this case, we have a market size of ~291k customers, employing ~1.89 million people.
Of course, many B2B SaaS companies target multiple industries, so we can very quickly add up the numbers across say, “professional services” and get some pretty reliable market size estimates.
However, these data sets are often quite large and can be challenging to interpret depending on what the data represents. Breaking away from our B2B SaaS example, check out this data set from the US Department of Education:
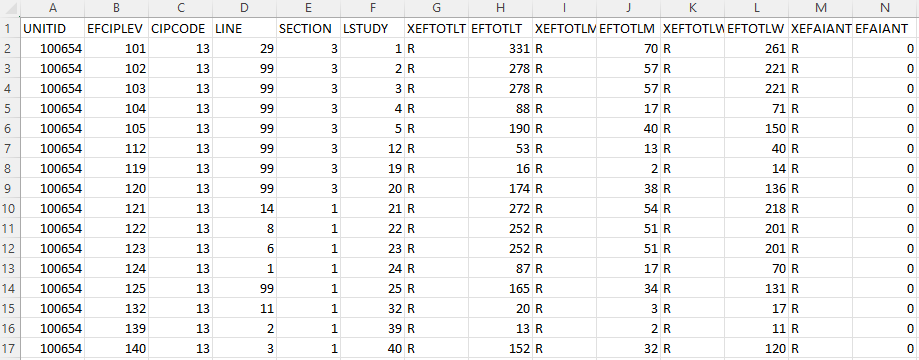
At face value, it’s basically impossible to derive any insights from this spreadsheet. This data set is raw survey data from the 2020 Fall Enrollment Survey for educational institutions. However, with the help of the accompanying definition file & a few phone calls to their statistics help desk (who were very helpful and more than happy to take the call), I was able to build strong bottom-up market sizing for the education sector.
Data Presentation
When presenting TAM data, I try to focus on a few things:
The overall TAM:
Who could be buying this product in 10 years? Include all possible customer segments.
Break down the TAM figure by customer segment, and display it as a table.
Drill down into the SAM/SOM by using the ICP:
Who is this company selling to over the next 3-5 years?
Again, display as a table.
Tie this market size & segmentation back to the company’s GTM strategy:
Show why you have chosen the right data & sizing method.
Usually, I write a few sentences about why the SAM/SOM is accurate, and how the company plans to break into that market.
As a side note, I tend to focus my market sizing on the US market exclusively. Unless there is great data for other geographies or the company is specifically going after another market entirely.
Managing Confirmation Bias
What if you don’t find great data to support the market size you're looking for? In a recent 20VC episode, Jason Lemkin said something along the lines of:
“Once VCs decide to do a deal, and they don’t want to hear reasons to not do it”.
While he was referring to the broader due diligence process, I think there is an important takeaway when looking at market size:
Because market size can be very abstract (especially for new markets), it’s easy to skew data in favor of a deal you really like. As a result, it might be tempting to point towards the market growth or “CAGR” to support an overall estimate. Now you are getting away from the data and talking about underlying trends in technology, business, or consumer behavior. Be sure to include some supporting information if that is the route you take.
The best way I’ve found to manage this is by sticking to a bottom-up process. I focus exclusively on quantifying the number of customers, and then applying some monetization rate I think is reasonable.
Even for markets that don’t yet exist - you can always find out the potential number of customers because in every case they themselves exist. Five years ago, generative AI was a market that didn’t exist (in the same way it does today) - but all the customers did.
The key here is to take the use case the founder presents at face value. You can validate that through customer / potential customer calls, but if you don’t believe in the use case; your market size is probably the least of your concerns.
Relevant Reads
Todd Wenning talks about position sizing when constructing a portfolio of investments. While this article seems to cater to the public equities world, there are some key points I think apply quite well to venture: Link
Benedict Evans shares some thoughts on Generative AI and intellectual property: Link